
Freeport-McMoRan: The Recent Weakness Is An Opportunity (NYSE:FCX)
Minakryn Ruslan/iStock via Getty Images")
Introduction
The Phoenix-based Freeport-McMoRan (NYSE:FCX), the world’s largest publicly-traded copper company, released its first quarter of 2022 results on April 21, 2022.
1 – First quarter 2022 results snapshot
Freeport-McMoRan posted a quarterly profit of $1,527 million or $1.04 per share, beating analysts’ expectations. The adjusted earnings per share came in at $1.07 per share. The net income was more than double from the year-ago quarter.
Revenues climbed 36.1% year over year to $6,603 million. Freeport-McMoRan benefited from higher realized prices and lower costs in 1Q22.
Consolidated production totaled 1.009 billion pounds of copper, 415 thousand ounces of gold, and 21 million pounds of molybdenum in the first quarter of 2022. Unit cash cost per CU Lbs was $1.33 in 1Q22.
Consolidated sales from mines increased 24.1% year over year to 1,024 million pounds of copper. The company sold 409K ounces of gold and 19 million pounds of molybdenum in the first quarter.
CEO since 2003, Richard Adkerson, said in the conference call:
The case for copper as a commodity is strong. I’ve been saying this for 20 years, but it’s never been better.
Demand is growing globally. Globally, growth is no longer dependent solely on China. With COVID recovery, infrastructure spending, the spread of electricity everywhere, it’s generating significant growth in Europe. Business is strong in the U.S. and in Asia, outside China.
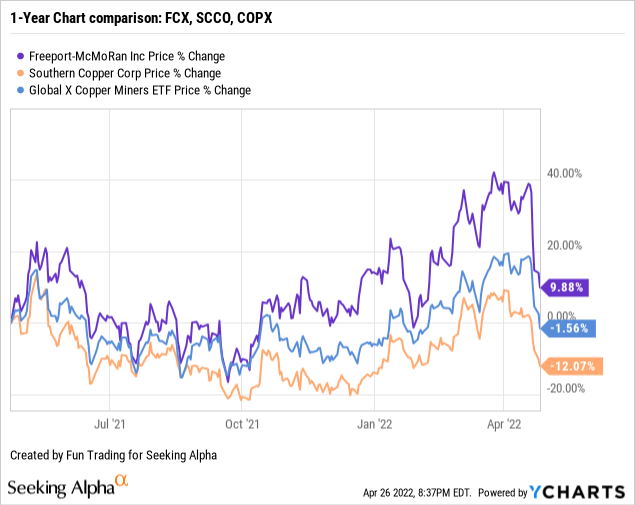
2 – Stock performance
Freeport-McMoRan has significantly outperformed most of its peers. However, the copper industry sold off dramatically in the past week, and FCX is now up 10% in a one-year.
3 – Investment Thesis
The investment thesis is straightforward here. If you believe that copper is essential for world recovery, it is crucial to invest in FCX long-term.
Freeport-McMoRan offers the best business model from a long-term investment perspective. The company is one of the most prolific producers of copper and produces a significant amount of gold.
Our family portfolio owns long-term FCX and Southern Copper (SCCO) in this industry.
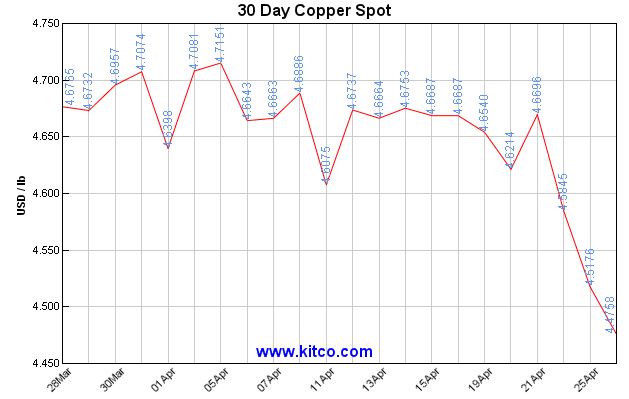
China’s COVID-19 outbreak already has slowed economic activity. The recent weakness in copper futures to around $4.5 per pound is coronavirus-induced lockdowns in China, a top consumer. The market responded after voicing concerns about a drop in demand.
However, on the supply side, troubles are brewing in Peru and Chile, which are among the leading copper producers in the world, well above the US, China, and Russia. In Peru, copper production has been weakening.
In Peru, Southern Copper Corp’s Cuajone copper mine production has been suspended for 52 days, and Anglo American’s (OTCQX:AAUKF) (OTCQX:NGLOY) Los Broncos copper project did not get the extension expected.
The strategy that I recommend is to trade 40% LIFO of your total position. It will let you keep a core long-term position for higher ground and enjoy a secure dividend which hopefully will be higher in 2022. By trading LIFO, you always sell the most recent purchases whereas your core long-term is not affected.
Freeport-McMoRan – 1Q22 – Balance Sheet and Trend – The Raw Numbers
| Freeport-McMoRan | 1Q21 | 2Q21 | 3Q21 | 4Q21 | 1Q22 |
| Total Revenues in $ Million | 4,850 | 5,748 | 6,083 | 6,164 | 6,603 |
| Net income in $ Million | 718 | 1,083 | 1,399 | 1,106 | 1,527 |
| EBITDA $ Million | 1,962 | 2,559 | 3,026 | 2,712 | 3,329 |
| EPS diluted in $/share | 0.48 | 0.73 | 0.94 | 0.74 | 1.04 |
| Cash from Operations | 1,075 | 2,395 | 1,965 | 2,280 | 1,691 |
| Capital Expenditure In $ Million | 370 | 433 | 541 | 771 | 723 |
| Free Cash Flow in $ Million | 705 | 1,962 | 1,424 | 1,509 | 968 |
| Total Cash $ Million | 4,580 | 6,313 | 7,672 | 8,068 | 8,338 |
| Total Long-term Debt in $ Million | 9,809 | 9,695 | 9,665 | 9,450 | 9,621 |
| Quarterly Dividend $/share |
0.075 |
0.075 |
0.075 |
0.15 |
0.15 |
| Shares outstanding (diluted) in Billion | 1,477 | 1,483 | 1,484 | 1,482 | 1,469 |
Source: Company news
Analysis: Revenues, Free Cash Flow, Mineral Reserves, and Copper/Gold/Molybdenum Production
1 – Revenues were $6.603 billion for the first quarter of 2022
FCX: Quarterly Revenues history (Fun Trading) The first quarter of 2022 revenue was $6.603 billion, up 36.1% from the same quarter a year ago and up 7.1% sequentially.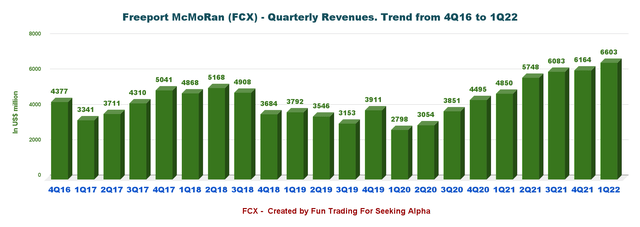
The net income was $1,527 million, or $1.04 per diluted share, compared to $718 million, or $0.48 per diluted share the same quarter a year ago. The adjusted earnings per share were $1.07 per share. It was another solid record quarter.
One crucial element is that the copper price has climbed significantly to a new multi-year record in 1Q22 with an average of 4.66 per pound, up roughly 18.3% year over year.
FCX: Quarterly Copper Price history (Fun Trading) However, the copper price has dropped significantly since the end of April. FCX: 30-day Copper Chart (KITCO)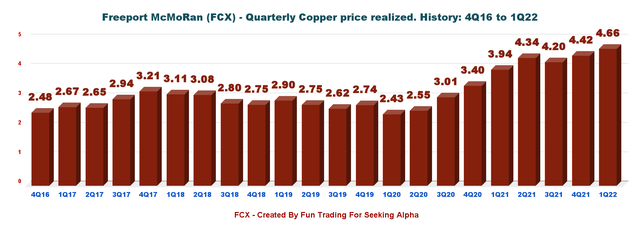
2 – Free cash flow was $1,509 million in the first quarter of 2022
FCX: Quarterly Free Cash Flow history (Fun Trading) Note: I calculate the generic free cash flow using the cash from operating activities minus CapEx.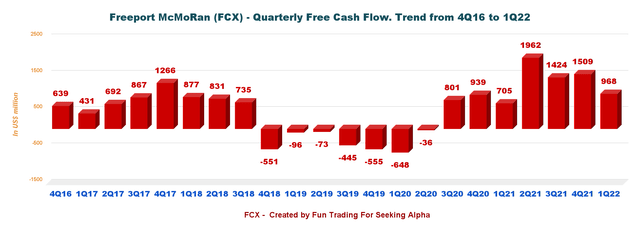
Trailing 12-month free cash flow was $5,863 million, with $968 million in 1Q22. The company generates some impressive free cash flow, resulting in higher dividends and share buybacks.
The total cash cost for the dividend is now $882 million a year based on a quarterly dividend of $0.15 per share (including variable dividend)— representing a dividend yield of 0.75%, which I consider inadequate considering the free cash flow level.
3 – Net debt is down to $1.283 billion in 1Q22
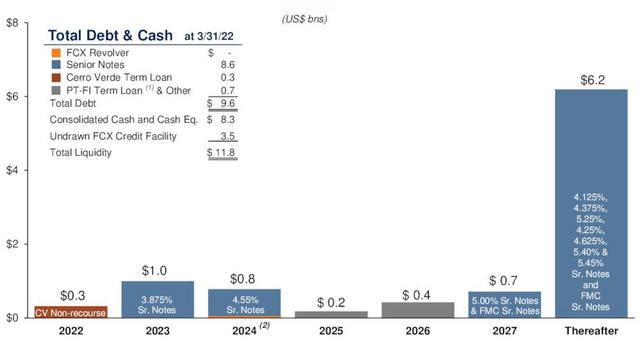
FCX: Quarterly Cash versus Debt history (Fun Trading) FCX: Debt Maturities Presentation (Freeport-McMoRan)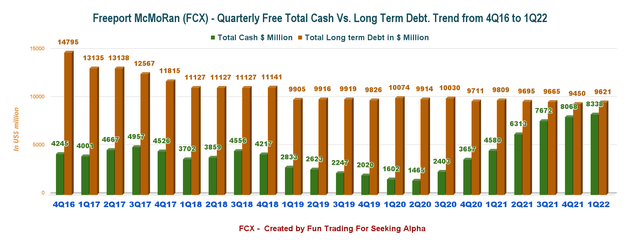
The company’s cash position is increasing significantly, as shown in my chart above, and it is vital to start repaying the debt. I consider it a priority for FCX even before any shares buyback that I believe is a pure waste of precious cash.
4 – Metal Production analysis – Copper/Cu, Gold/Au, and Molybdenum/Mo
4.1 Gold and Copper production
FCX: Quarterly Production 3E history (Fun Trading) Production increased 19.6% to 1,009 million pounds (net 810 million pounds) from 864 million pounds in the same quarter a year ago (see chart above).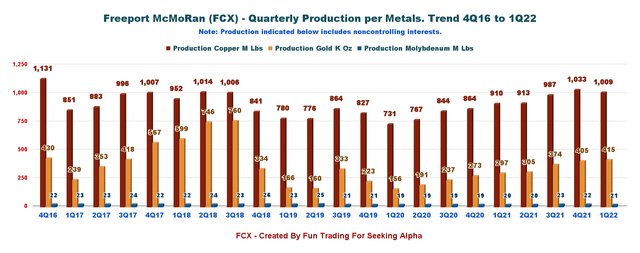
The gold production increased to 405K oz (net 329K ounces), and 22 M lbs of Molybdenum were produced (net 19 M lbs). Gold and copper are increasing nicely with the successful ramp-up of the Grasberg underground mine.
Sales were 1,020 M Cu lbs., 395K oz. of gold, and 19 M lbs. of Mo.
Below are the Copper, gold, and molybdenum prices received by Freeport-McMoRan over the past five quarters:
| Price | 1Q21 | 2Q21 | 3Q21 | 4Q21 | 1Q22 |
| Copper price realized – Cu per pound | 3.94 | 4.34 | 4.20 | 4.42 | 4.66 |
| Gold price Realized – Au per ounce | 1,713 | 1,794 | 1,757 | 1,808 | 1,920 |
| Molybdenum price realized – Mo | 11.62 | 13.11 | 18.61 | 19.42 | 19.30 |
Source: Fun Trading
4.2 Production of Copper, Gold, and Molybdenum per mine in 1Q22
FCX: Production detail per mine history (Fun Trading) Note: The average net cash costs were $1.33 per pound of copper in the first quarter of 2022 and $1.34 per pound in 2021. Unit net cash costs are expected to average $1.35 per pound of copper for 2022.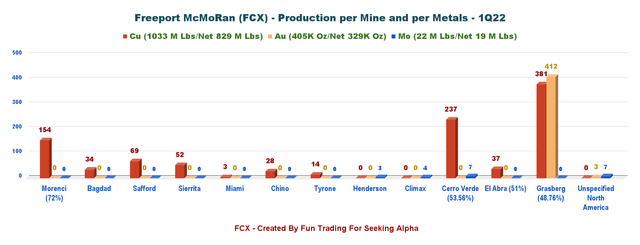
4.3 Reserves situation as of 12/31/2021
FCX: 2021 mineral reserves (Freeport-McMoRan Presentation)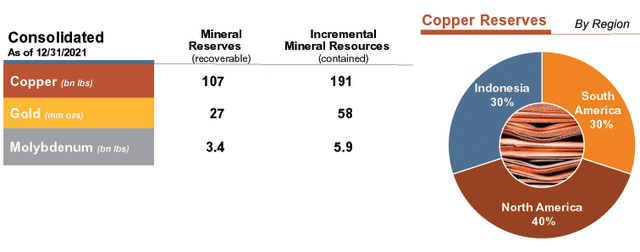
5 – Production outlook for 2022 and other data
Production for 2022 is expected to be 4.25 billion pounds of copper, 1.6 Moz of Gold, and 80 Mlbs of Molybdenum at unit cash costs of $1.35 per pound.
FCX 2022 Outlook Presentation (Freeport-McMoRan ) FCX: TA chart short-term (Fun Trading)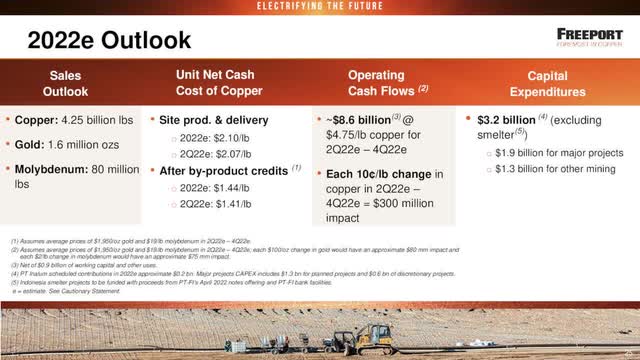
Technical Analysis (short-term) and Commentary
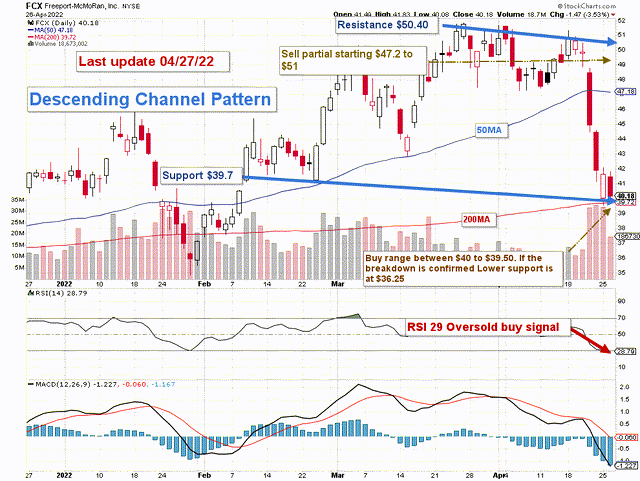
Note: The chart is adjusted for the dividend.
FCX forms a descending channel pattern with a resistance of $50.4 and support at $39.7.
The trading strategy that I recommend is to trade LIFO about 40% of your FCX position. I suggest selling partially in the range of $47.2 and $51 and waiting for a retracement below $40-$39.50.
The copper price is weakening a little now but still well above $4 per pound, which could drop below $40 for FCX, which I am comfortable adding to my position.
However, the copper price, a crucial component for FCX, may turn bearish if the world economy starts to falter due to geopolitical troubles (Russia’s invasion of Ukraine) and the resurgence of the COVID-19 infection in China.
In this case, FCX could quickly drop below $36.25. Conversely, the same reasoning could boost the copper price above $5-$6 per pound, pushing FCX above $51 again.
Warning: The TA chart must be updated frequently to be relevant. It is what I am doing in my stock tracker. The chart above has a possible validity of about a week. Remember, the TA chart is a tool only to help you adopt the right strategy. It is not a way to foresee the future. No one and nothing can.
Watch the price of gold and copper like a hawk.
Author’s note: If you find value in this article and would like to encourage such continued efforts, please click the “Like” button below as a vote of support. Thanks!


